Swing Trading Strategy: Visualizing Order Flow for Profits
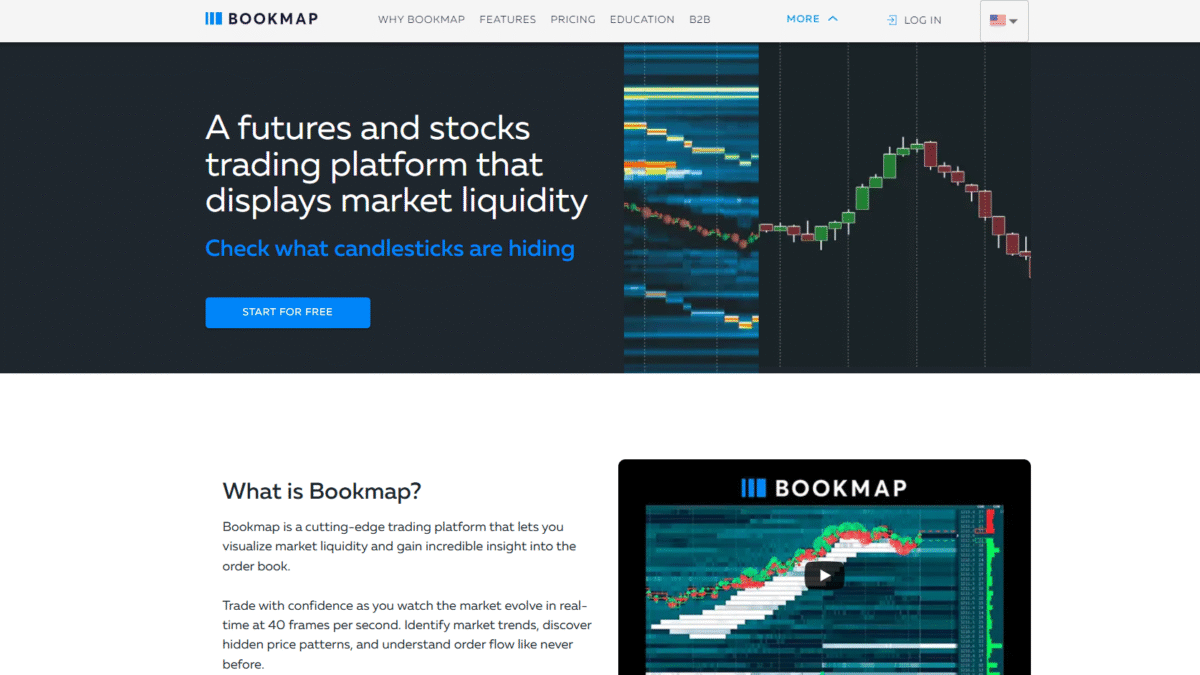
In the fast-paced world of swing trading, spotting high-probability setups often comes down to understanding where the big orders are lining up. Traditional charts show price and volume, but they don’t reveal the hidden layers of liquidity beneath the surface. That’s where Bookmap steps in, giving you a real-time heatmap of limit orders and executed trades so you can anticipate moves before they happen.
Why Order Flow Matters in Swing Trading
Swing trading thrives on medium-term price swings. Identifying support and resistance zones in advance can help you capture entire legs of a move instead of just quick scalps. By visualizing order flow, you:
- See where buyers and sellers are stacking orders
- Spot hidden supply and demand levels not visible on candlesticks
- Gauge institutional participation by tracking large volume clusters
How Bookmap Illuminates Market Liquidity
Bookmap transforms the order book into a dynamic heatmap, updating at 40 frames per second. Key features that swing traders rely on include:
Liquidity Heatmap
The heatmap shows resting limit orders at each price level. Brighter “liquidity walls” often act as support or resistance, teaching you exactly where price is likely to stall or reverse.
Volume Bubbles
Each executed trade is plotted as a bubble—large bubbles highlight big block trades. This helps you see when aggressive buyers or sellers step in, often signaling momentum shifts.
Best Bid and Offer (BBO)
Watch how incoming volume interacts with the bid-ask spread. Sudden absorption or exhaustion of liquidity at the BBO can foreshadow breakouts or reversals.
Current Order Book
Customize how you view depth of market. See the exact size of orders at each price, filter out noise, and track order adds/cancels to avoid trading into hidden traps.
Nanosecond Zoom
Zoom in to micro-timeframes without missing a beat. Observe reactions to news events or big block orders in incredible detail—like rewinding and playing back the market in real time.
Building Your Swing Trading Strategy with Order Flow
- Identify Key Levels: Use the heatmap to mark dense liquidity walls.
- Confirm with Volume Bubbles: Look for clusters of large bubbles at those levels to validate strong support or resistance.
- Watch for Shifts at the BBO: Entry signals often come when aggressive orders push through or get absorbed at the spread.
- Plan Your Exit: Map out profit targets at the next significant heatmap clusters and set stop losses just beyond them.
Real-World Example: Swinging a Trend Reversal
Imagine ES futures trending lower into a bright wall of liquidity at 3,900. You see a flurry of big volume bubbles testing that wall but failing to break it. At the same time, incoming bids start to absorb the offers. That confluence signals a potential reversal. You enter a long swing, ride the bounce up to the next heatmap wall, and lock in a 20-tick gain—all based on visual order-flow evidence.
Getting Started in Minutes
Setting up Bookmap is straightforward:
- Install the platform and connect to your data provider or broker
- Load the futures or stock symbol you trade and enable the heatmap
- Join a free webinar to learn basic and advanced tactics
Get Started with Bookmap for Free Today and elevate your swing trading edge by seeing the hidden orders that drive market moves.
Conclusion
For serious swing traders, mastering order flow isn’t optional—it’s essential. Bookmap’s real-time liquidity heatmaps, volume bubbles, and depth-of-market tools reveal the footprints of big players, helping you anticipate price swings with confidence. Don’t trade in the dark; illuminate your charts with unmatched transparency and start capturing bigger, more reliable moves today. Get Started with Bookmap for Free Today.