Swing Trading Secrets: Visualize Liquidity and Order Flow
If you’re serious about swing trading, you know that spotting genuine price moves before the crowd can mean the difference between a winning trade and a costly miss. Traditional charts and indicators often lag behind the action, leaving you guessing at true support and resistance levels. That’s where visualizing market liquidity and order flow becomes a powerful edge.
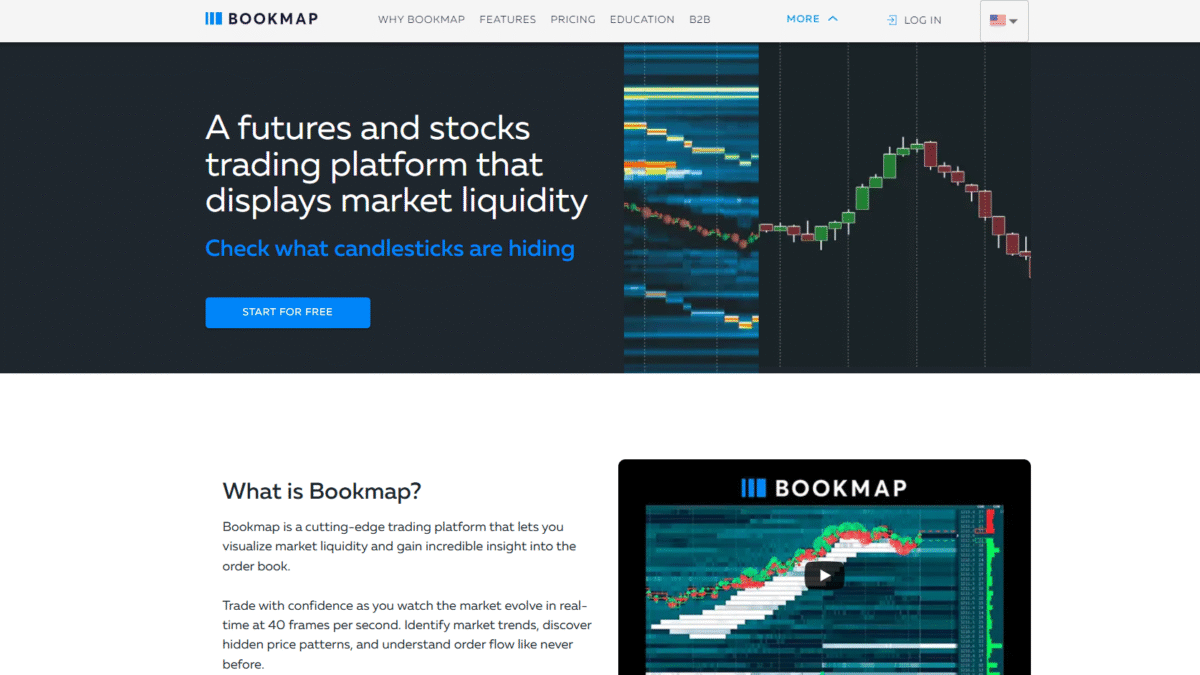
Enter Bookmap, the ultimate platform for real-time depth analysis. With Bookmap, you’ll see every limit order placed on the exchange as it happens, display it in an intuitive heatmap, and watch the market evolve at 40 frames per second. This level of transparency lets you anticipate sudden reversals, confirm breakout strength, and refine your entry and exit points with surgical precision.
Why Liquidity Visualization Matters for Swing Traders
In swing trading, you’re holding positions for hours or days, aiming to capture multi-point moves. During that time, order imbalances and hidden liquidity pools can trigger abrupt price swings. By tracking the depth of market in real time, you can:
- Identify clusters of large resting orders acting as strong support or resistance.
- Detect exhaustion when aggressive buyers or sellers hit the best bid or offer.
- Confirm breakout validity by watching volume bubbles push through key levels.
Key Features to Unlock Your Swing Trading Potential
Liquidity Heatmap
Stop trading blind. The heatmap displays all limit orders over time, using intensity to highlight where liquidity is stacking up. You’ll know exactly which price zones attract institutional interest.
Volume Bubbles
Volume bubbles go beyond simple bars by sizing and coloring trades according to aggressor type. In seconds, you can see whether buyers or sellers dominate a critical zone.
Best Bid and Offer (BBO)
Observe the highest bid and lowest offer in real time to spot absorption or exhaustion. A sudden shift in the bid-ask spread can flag a powerful reversal in progress.
Current Order Book
View the full depth of market with customizable columns. Filter out noise, focus on icebergs, and watch hidden orders refresh at each price level.
Nanosecond Zoom
Zoom in to the micro-timeframe and catch every tweak in volume, liquidity, and BBO—plotted with video-game–style frame rates for seamless playback.
Multi-Asset Coverage
Toggle between futures, stocks, and cryptocurrencies with a single click. Perfect for swing traders who diversify across markets.
Record & Replay
Record live sessions, then replay them to refine strategies. Simulate orders and test your setups under historical market conditions.
Customizable Charts
Tailor every aspect of the display. Add candlesticks, volume bars, or custom indicators to match your preferred analytical style.
Make Smarter Swing Trading Decisions
With Bookmap’s transparent view of order flow and market depth, you’ll enter trades with greater confidence, manage risk more effectively, and pinpoint high-probability setups that others simply can’t see.
Get Started with Bookmap for Free Today and experience the power of true liquidity visualization. Whether you’re new to swing trading or a seasoned veteran, Bookmap will revolutionize how you read the market.