Reveal Hidden Liquidity with Heatmap Indicators
Trading in fast-moving markets can feel like trying to navigate a pitch-black room—order flow is hidden, liquidity zones shift in real time, and sudden reversals strike without warning. Enter the heatmap indicator, a revolutionary way to light up the order book and expose where major limit orders lie. With Bookmap’s liquidity heatmap, you can finally see the ebb and flow of supply and demand, pinpoint genuine support and resistance levels, and trade with unmatched confidence.
Why a Heatmap Indicator Matters
Traditional charts only show executed trades—by then, it’s often too late to act. A heatmap indicator reveals live depth-of-market data, plotting every new limit order, cancellation, and execution as colored “liquidity bands.” Bright bands mark heavy resting orders; dimmer areas indicate thinner liquidity. This dynamic view helps you:
- Spot true price barriers before they break.
- Anticipate rapid moves by watching shifting heat zones.
- Differentiate between short-lived spikes and sustainable flows.
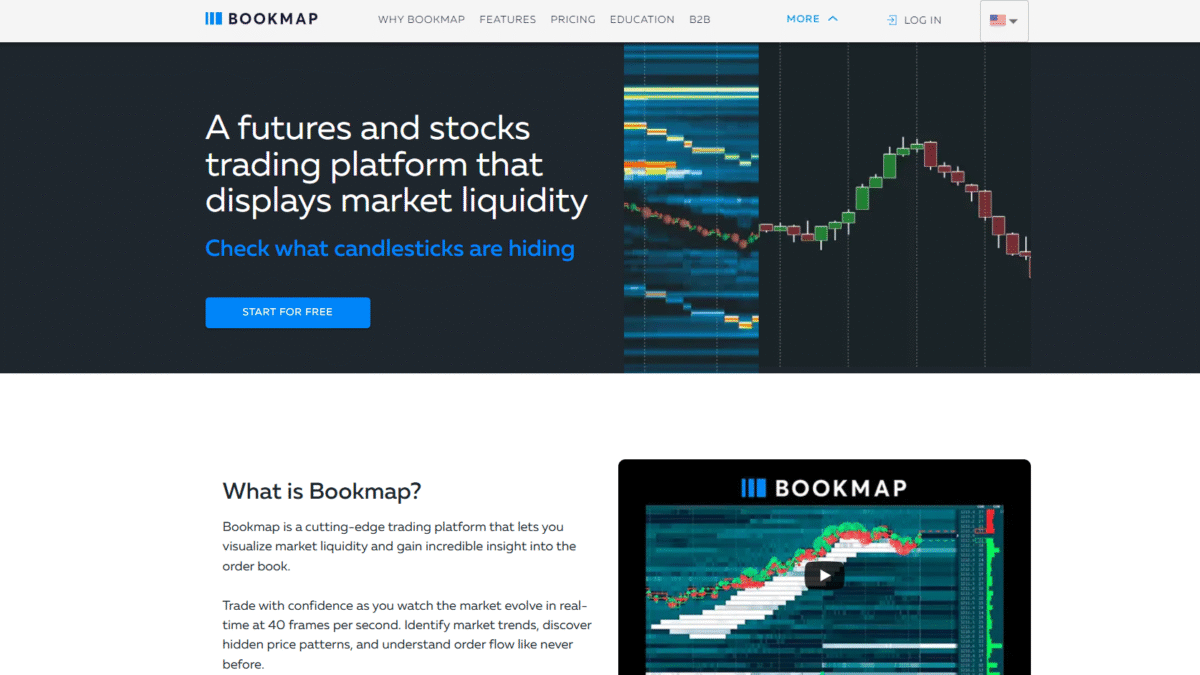
How Bookmap’s Liquidity Heatmap Works
Bookmap streams market data at 40 frames per second, visualizing every change in the order book with nanosecond precision. Key components include:
- Live Depth-of-Market: See order sizes at each price level and track how they grow, shrink, or vanish.
- Color-Coded Bands: Brighter colors indicate larger cumulative resting volume—red for heavy buy support, blue for heavy sell resistance.
- Historical Footprints: Observe how liquidity bands evolved over time to validate key zones.
Real-Time Volume Bubbles
Volume bubbles overlay the heatmap to show aggressive market orders hitting bids or asks. Larger bubbles signal intense buying or selling pressure, often preceding sharp reversals or breakouts. Combined with the heatmap, you’ll gain a holistic view of both passive and aggressive flows.
Practical Trading Strategies
Here’s how you can apply the heatmap indicator with Bookmap:
- Support and Resistance Confirmation: Wait for a buildup of liquidity bands at key levels before entering a swing trade.
- Breakout Validation: Enter long or short only when volume bubbles push through a thinning heat zone.
- Order Flow Scalping: Use rapid changes in the heatmap to scalp small gains as liquidity shifts.
Getting Started Is Easy
1. Install Bookmap and connect to your preferred market data provider.
2. Join free live webinars to master the heatmap and volume tools.
3. Start watching hidden liquidity reveal itself in real time.
Don’t trade blind. Illuminate your charts with the heatmap indicator and discover where institutions are placing their orders. Get Started with Bookmap for Free Today and unlock a new dimension of market transparency.