Master Liquidity Trading with Real-Time Market Heatmaps
In today’s fast-paced markets, liquidity trading demands precision, speed, and the ability to see beyond simple price charts. Traders who master order flow and real-time depth can anticipate turning points, detect large orders, and avoid false breakouts. Visualizing liquidity in motion transforms guesswork into strategy—and that’s where Bookmap shines. By offering a live heatmap of limit orders, footprints of traded volume, and razor-sharp zoom down to the nanosecond, Bookmap empowers you to trade with clarity and confidence. Ready to experience the difference? Get Started with Bookmap for Free Today.
What Is Liquidity Trading?
Liquidity trading is the practice of analyzing the supply and demand dynamics at each price level within an order book to inform buy and sell decisions. Instead of relying solely on price movements, liquidity traders study the depth of market, large pending orders, and the pace at which trades consume resting liquidity. This approach uncovers hidden support and resistance, reveals potential institutional activity, and highlights where the true battle between buyers and sellers unfolds.
Why Real-Time Market Heatmaps Matter
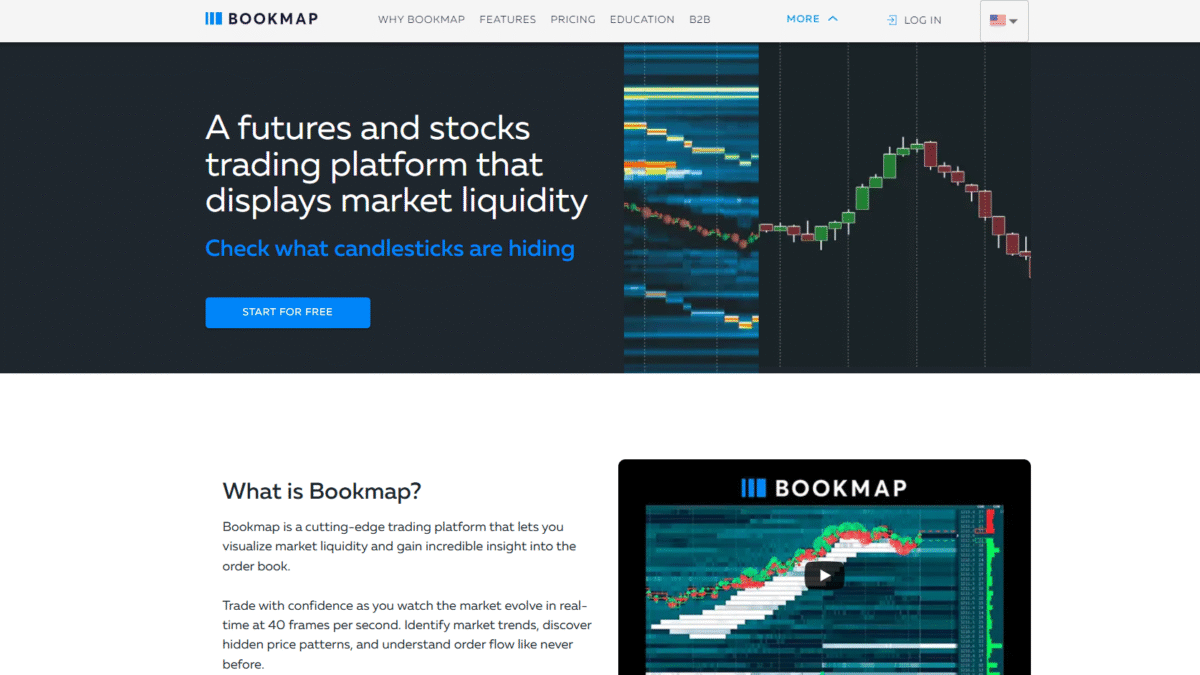
Traditional charts show only executed trades and aggregated volume bars—leaving out the context of where orders sit and how they evolve. A real-time heatmap displays limit orders as colored bands that brighten with density, illustrating flood zones of liquidity and shifting walls of bids and offers. By watching orders appear, get filled, or vanish at 40 frames per second, you gain:
- Instant visibility into support and resistance levels
- Alerts on iceberg orders and hidden liquidity
- Context for momentum runs and sudden spikes
This depth of insight gives you a competitive edge—no wonder top futures, crypto, and equity traders rely on Bookmap for real-time heatmaps.
Core Components of Liquidity Trading with Bookmap
1. Liquidity Heatmap
The heart of Bookmap is its Liquidity Heatmap, which visualizes every posted limit order on the exchange over time. Deeper red and yellow bands indicate heavy liquidity concentrations, revealing true support and resistance better than static lines on a chart.
- Track moving liquidity walls forming at key levels
- Spot liquidity sweeps when large orders pull away
- Identify absorption—where aggressive orders fail to move the price
2. Volume Bubbles
While volume bars show aggregate traded size, Bookmap’s Volume Bubbles plot each trade as a circle sized by volume and colored by aggressor side. Instantly see when institutions step in to reverse trends or flood the market.
- Large red or green bubbles signal heavy selling or buying pressure
- Clustering at key levels often precedes breakouts or reversals
- Contrast real-time volume with heatmap liquidity to gauge exhaustion
3. Best Bid and Offer (BBO)
Bookmap tracks the Best Bid and Offer continuously, showing the spread dynamics as orders enter and exit. Watching how volume reacts at the BBO helps you detect absorption (when large buyers step in at the offer) or exhaustion (when sellers can’t push through the bid).
4. Current Order Book
See the full depth of market with Bookmap’s configurable Current Order Book. Toggle between price ladder and heatmap views to suit your style, whether you prefer numeric detail or a graphical representation of liquidity layers.
5. Nanosecond Zoom
Time compression is crucial in high-frequency environments. Bookmap’s industry-leading Nanosecond Zoom displays every event—order additions, cancellations, and trades—at micro-timeframe precision. It’s like watching the market in slow motion while trading in real time.
How to Get Started in Three Simple Steps
Integrating Bookmap into your workflow takes just minutes:
- Install Bookmap & Connect Data: Download the platform and link to your broker or data provider. For CME, CBOT, COMEX, and NYMEX MBO data, subscribe to BookmapData.
- Educate Yourself: Access live basic and advanced webinars, tutorials, and documentation at no extra cost.
- Execute with Confidence: Monitor real-time liquidity, volume, and order flow to make informed entry and exit decisions.
Experience the clarity of real-time market heatmaps—Get Started with Bookmap for Free Today.
Benefits of Mastering Liquidity Trading
- Enhanced Entry Timing
By tracking where liquidity walls sit and listening to absorption, you enter near optimal support or resistance. - Reduced False Breakouts
Spot real breakouts fueled by genuine order flow rather than random spikes. - Improved Risk Management
Know where large resting orders can cap moves, allowing tighter, more precise stops. - Deeper Market Understanding
See institutional footprints and hierarchy within the order book that price alone can’t reveal. - Increased Confidence
Trade with empirical data on liquidity shifts rather than relying on lagging indicators.
Who Should Use This Approach?
Day Traders
If you scalp futures or stocks, real-time heatmaps let you snipe entries with surgical accuracy and avoid getting swallowed by sudden liquidity holes.
Swing Traders
Analyze how large orders build at support or resistance over hours and days to complement longer-term technical setups.
Algorithmic Traders
Integrate Bookmap’s API to feed live liquidity data into your models for predictive order-flow algorithms.
Record, Replay, and Refine Your Strategy
One of Bookmap’s most valuable features is the Record/Replay mode. Capture entire trading sessions and replay them at variable speeds to dissect every liquidity shift and big trade. Test hypothetical orders in simulated mode, adjust your approach, and progressively refine your tactics.
Customizable Charts to Match Your Style
Your workflow is unique. Arrange multiple windows, overlay candlesticks and volume bars, or focus purely on heatmap depth. Bookmap’s fully configurable interface adapts to your preferences, whether you run a single monitor or a multi-screen rig.
Multi-Asset Coverage
Switch seamlessly between Futures, Stocks, and Cryptocurrencies at the click of a button. Consolidate your liquidity trading across asset classes within one platform and maintain a unified view of order flow dynamics.
Conclusion
Mastering liquidity trading means looking beyond price and understanding the hidden forces shaping market moves. With Bookmap’s real-time heatmaps, volume bubbles, nanosecond zoom, and comprehensive order-book tools, you gain unprecedented clarity and control. Transform your trading from reactive to proactive—Get Started with Bookmap for Free Today and unlock the power of real-time market liquidity visualization.