Master Liquidity Trading with Real-Time Heatmap Insights
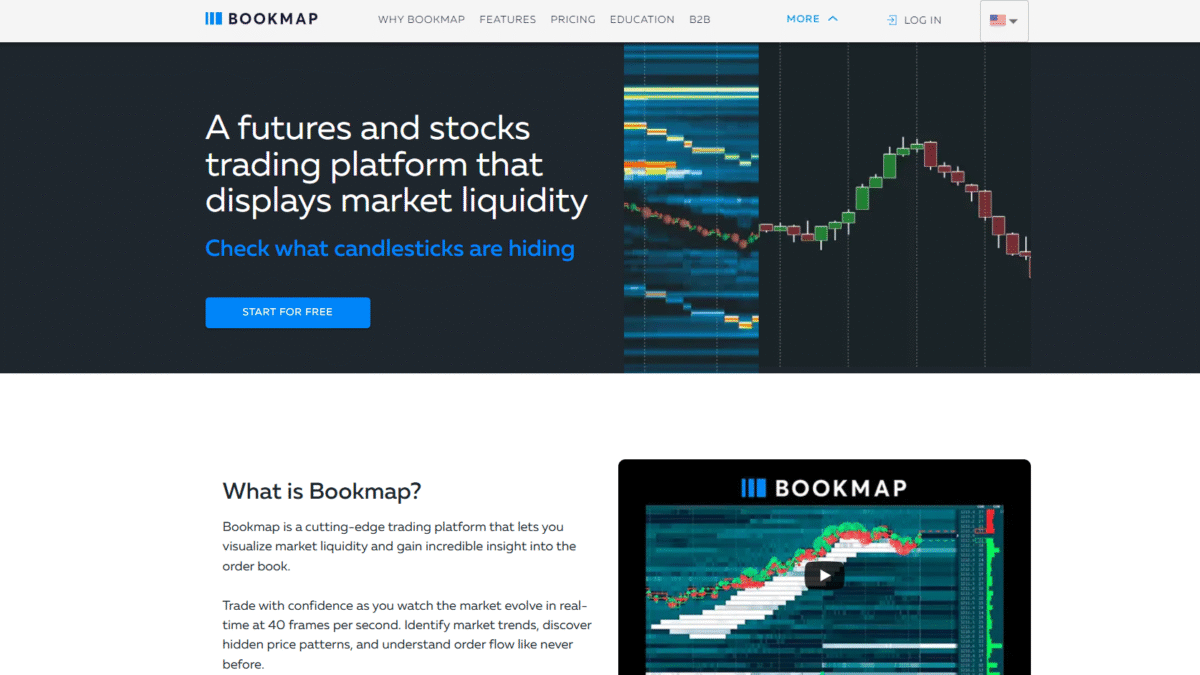
In the fast-paced world of liquidity trading, every millisecond matters. When market depth shifts and orders flood the tape, you need clarity—instantly. With Bookmap’s real-time heatmap visualization, you can see every limit order and trade event unfolding right before your eyes at 40 frames per second. No more guesswork, no more lag—just actionable insight into where liquidity concentrates and how it moves.
Understanding Liquidity Trading
Liquidity trading focuses on identifying pockets of limit orders at different price levels and anticipating how the order flow will drive price action. Traditional charts only show executed trades, leaving you in the dark about hidden support and resistance zones. By uncovering the full depth of market liquidity, you gain the edge to enter or exit positions at optimal prices and ride momentum with confidence.
Key Challenges for Liquidity Traders
- Invisible Order Flow: Standard time-price charts hide resting orders—you never know who’s lining up to buy or sell.
- Delayed Data: Aggregated quotes can lag, making it hard to react to sudden liquidity surges or withdrawals.
- Overcrowded Indicators: Volume bars and moving averages offer context but not the real-time puzzle pieces of where orders accumulate.
How Bookmap Revolutionizes Your Trading
Bookmap is built from the ground up for serious liquidity trading. Its intuitive interface and high-performance data engine reveal every nuance of the order book in real time. Here’s what you’ll get:
Liquidity Heatmap
Stop trading blind. The heatmap displays every limit order’s intensity over time, letting you:
- Spot genuine support and resistance levels.
- See order book shifts before price reacts.
- Anticipate breakouts when liquidity walls weaken.
Volume Bubbles
Not all volume is created equal. Volume bubbles highlight aggressive buying or selling that can reverse trends in an instant. You’ll be able to:
- Distinguish between large institutional orders and retail noise.
- Gauge real-time pressure on bids versus asks.
- Optimize entries by tracking aggressive volume spikes.
Best Bid and Offer (BBO)
See the true spread dynamics as they evolve. Bookmap plots the highest bid and lowest ask, so you can:
- Detect exhaustion or absorption at key levels.
- Time your orders when the spread tightens for minimal slippage.
- Validate breakouts by watching how incoming trades interact with the BBO.
Current Order Book & Nanosecond Zoom
Get full transparency on every price level, from deep liquidity zones to microsecond fluctuations:
- Configure depth-of-market views to match your style.
- Zoom in on nanosecond ticks for ultra-precise analysis.
- Experience live data with video-game fluidity at 40 fps.
Multi-Asset Coverage & Record/Replay
Switch seamlessly among futures, stocks, and cryptocurrencies. Plus, record your sessions for later playback to:
- Review key setups and missed opportunities.
- Backtest strategies in a simulated environment.
- Continuously refine your approach using historical liquidity patterns.
Getting Started Is Easy
- Install Bookmap and connect to your market data provider or broker.
- Join free basic or advanced webinars to master every feature.
- Watch live liquidity and volume unfold, then make informed trading decisions.
Ready to elevate your liquidity trading game? Get Started with Bookmap for Free Today and see market depth like never before.