Market Data Mastery: See Real-Time Liquidity Heatmaps
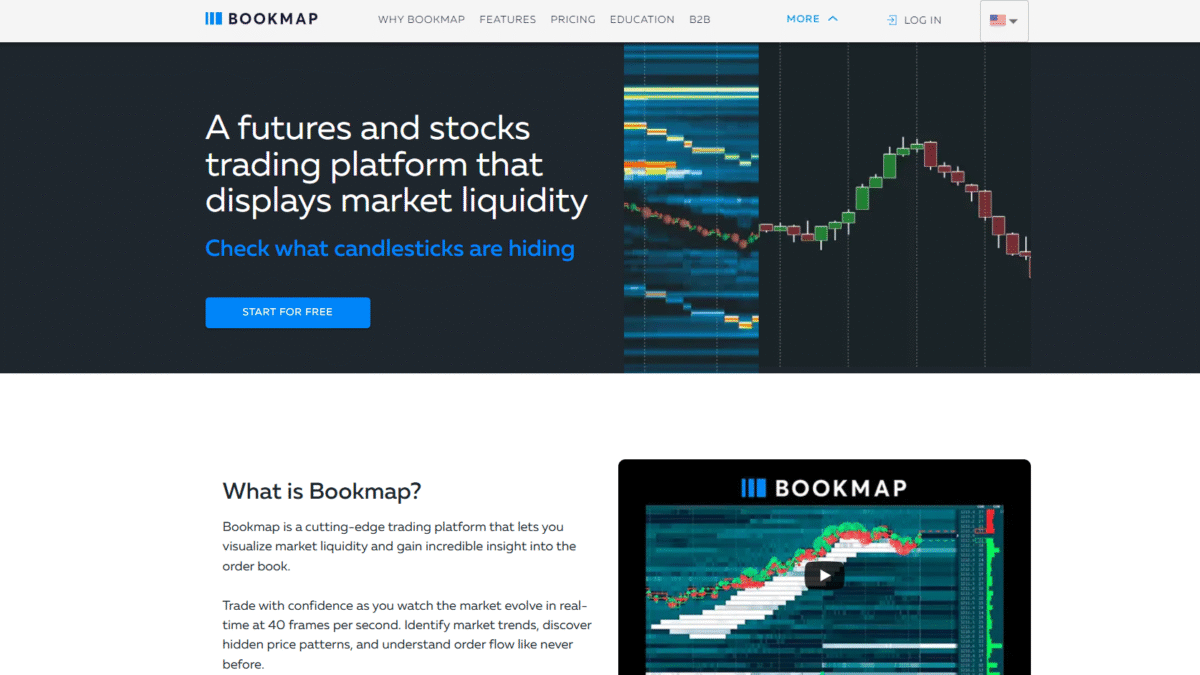
In today’s fast-moving financial markets, having access to accurate and timely market data is essential for anyone looking to trade with confidence. Traditional price charts only tell part of the story. To truly understand where liquidity is hiding, and to predict price moves before they occur, you need a clear view into the order book and the flow of orders. That’s where Bookmap comes in—an advanced trading platform that transforms raw market data into vivid, real-time liquidity heatmaps.
Why Real-Time Market Data Is a Game Changer
Market participants aren’t just interested in past prices; they want to see where big orders are posted, how they evolve, and how other traders are reacting. Real-time market data lets you:
- Spot hidden support and resistance levels based on order sizes rather than historical price points.
- Detect liquidity imbalances by observing large bid or ask clusters as they appear and disappear.
- Identify potential price reversals when aggressive trades exhaust available liquidity.
- React instantly to fast-moving conditions with updates delivered at 40 frames per second.
Introducing Bookmap: Market Data Visualized Like Never Before
Bookmap is more than just a charting tool. It’s a cutting-edge trading platform built around visualizing market data in powerful ways. Here’s what sets it apart:
- Liquidity Heatmap: A dynamic color-coded display of where limit orders accumulate over time, allowing traders to see true supply and demand levels.
- Volume Bubbles: Graphical representations of executed trades, highlighting imbalances between buyers and sellers at each price level.
- Best Bid and Offer: Real-time tracking of the highest bid and lowest ask, with insights into how incoming orders interact with the spread.
- Nanosecond Zoom: Industry-leading zoom capability to inspect micro-timeframe order flow with video-game-style frame rates.
- Multi-Asset Coverage: Seamlessly switch between futures, stocks, and crypto markets in a single interface.
- Record & Replay: Capture live sessions to review order flow and test strategies in simulation mode.
How Bookmap Harnesses Market Data to Empower Traders
Visualization is at the heart of Bookmap’s approach. By turning raw market data into intuitive graphics, traders gain a deeper understanding of order flow. For example:
When a large iceberg order sits quietly on the book, it’s often invisible on standard depth charts. Bookmap’s heatmap highlights that order’s presence from the moment it’s placed, giving you advance notice of potential support or resistance. Similarly, volume bubbles show where aggressive buys or sells are tackling standing orders, revealing exhaustion points before prices reverse.
Getting Started in Minutes
Bookmap makes it easy to tap into high-quality market data and begin analyzing order flow:
- Install Bookmap and connect to your preferred data provider or broker. For CME, CBOT, COMEX, and NYMEX futures, subscribing to BookmapData unlocks full depth-of-market feeds.
- Access free basic or advanced webinars and tutorials to master the interface and interpret the visual cues.
- Start watching real-time liquidity and volume dynamics to make informed trading decisions in any asset class.
Key Features That Put You Ahead
Liquidity Heatmap
Stop trading in the dark. Bookmap’s heatmap paints every resting order as a colored band that intensifies with size and duration. You’ll never miss a hidden wall of liquidity again.
Volume Bubbles
Volume bubbles go beyond simple bar charts by illustrating the concentration and intensity of executed trades. Large bubbles flag areas where aggressive traders are taking control, giving you clues about potential breakouts or reversals.
Best Bid and Offer (BBO)
Watching how incoming market orders interact with the BBO can signal absorption or exhaustion. Bookmap plots every snapshot of the spread, helping you predict where momentum is fading.
Current Order Book
Customize your depth-of-market view with full transparency of order sizes at each price point. Whether you prefer a ladder view or a classic depth chart, Bookmap adapts to your style.
Nanosecond Zoom
Dive into the microstructure of the market with frame rates up to 40 fps, so you never miss a blip in liquidity or a flash crash. Scrub through historical data to fine-tune your entries and exits.
Multi-Asset Coverage
Trade futures, stocks, and cryptocurrencies without switching platforms. Pop out charts for multi-monitor setups and keep a close eye on correlated markets.
Record & Replay
Capture live order flow to analyze afterward. Replay sessions with simulated orders to test strategies in real replicable conditions.
Why Market Data Transparency Matters
Hidden liquidity and spoofing have become major challenges for modern traders. Without clear insights, you risk entering or exiting positions at the worst possible times. With Bookmap’s unparalleled visualization of market data, you gain full transparency:
- Prevent whipsaws by seeing where liquidity is truly concentrated.
- Identify algorithmic trading patterns and exploit predictable behaviors.
- Enhance risk management by setting stops and limits based on actual order book dynamics.
Who Benefits Most from Bookmap?
Day Traders
Scalp small price moves by monitoring liquidity shifts on the heatmap. Anticipate intraday reversals before they show up on traditional candlestick charts.
Swing Traders
Spot accumulation or distribution zones where larger players are positioning. Time your entries with precision by observing persistent blocks of resting orders.
Algorithmic Traders
Refine your models by backtesting order flow data. Use the record & replay feature to simulate orders and analyze execution quality.
Institutional Participants
Get a granular view of market microstructure to optimize execution strategies and minimize market impact.
Real Results from Real Traders
“Bookmap transformed the way I view market data. I used to rely on volume bars and moving averages, but now I anticipate moves by watching liquidity build and fade. My win rate has gone up significantly.” – A futures day trader
“The nanosecond zoom feature is a revelation. I can see order book dynamics that were invisible on other platforms. It’s like trading with X‐ray vision.” – A high-frequency trading strategist
Start Visualizing Market Data Today
If you’re ready to stop guessing and start seeing the true pulse of the markets, Bookmap is the tool you need. Experience real‐time liquidity heatmaps, volume bubbles, and unmatched depth-of-market analysis for yourself. Get Started with Bookmap for Free Today and revolutionize your trading approach.
Don’t let hidden orders and invisible liquidity traps determine your next trade. Harness the power of precise market data visualization with Bookmap and trade with full transparency.