Conquer Volatility: Uncover Winning Stocks Fast
In the unpredictable world of volatility, traders and investors need tools that help them spot high-potential stocks before others. Finviz provides a powerful platform to conquer market swings and uncover winning opportunities quickly. With its real-time data, advanced screening, and intuitive visual maps, Finviz empowers you to navigate volatility and make informed trading decisions. Get Started with Finviz for Free Today
Understanding Market Volatility
Volatility measures how drastically a stock’s price moves over a given period. High volatility often signals greater risk but also presents more opportunities for profit when managed properly. Factors such as earnings reports, economic releases, geopolitical events, or sudden shifts in investor sentiment can trigger sharp price swings.
Successful traders embrace volatility by using data-driven strategies. Rather than fear rapid price changes, they focus on identifying patterns and setups that historically perform well when markets are choppy. That’s where Finviz shines—offering visual tools and screening filters that bring the most volatile movers to your attention in seconds.
Key Strategies to Trade in Volatile Markets
- Breakout Trading: Spot stocks that break above resistance levels with volume, riding momentum for quick gains when volatility spikes.
- Mean Reversion: Identify oversold or overbought conditions using technical indicators, then trade reversals back toward average price levels.
- Straddle Options: For options traders, entering both a call and put at similar strikes can profit from large moves in either direction.
- Risk Management: Always set stop-loss and take-profit levels to protect capital during unexpected swings.
- Correlation Plays: Use pairs trading to go long on one ticker while shorting its correlated counterpart, reducing marketwide directional risk.
How Finviz Helps You Manage Volatility
Finviz combines a user-friendly interface with powerful features to help you thrive in volatile conditions. Whether you’re hunting for breakout candidates or diversifying risk across inverse correlations, Finviz delivers critical insights with minimal fuss.
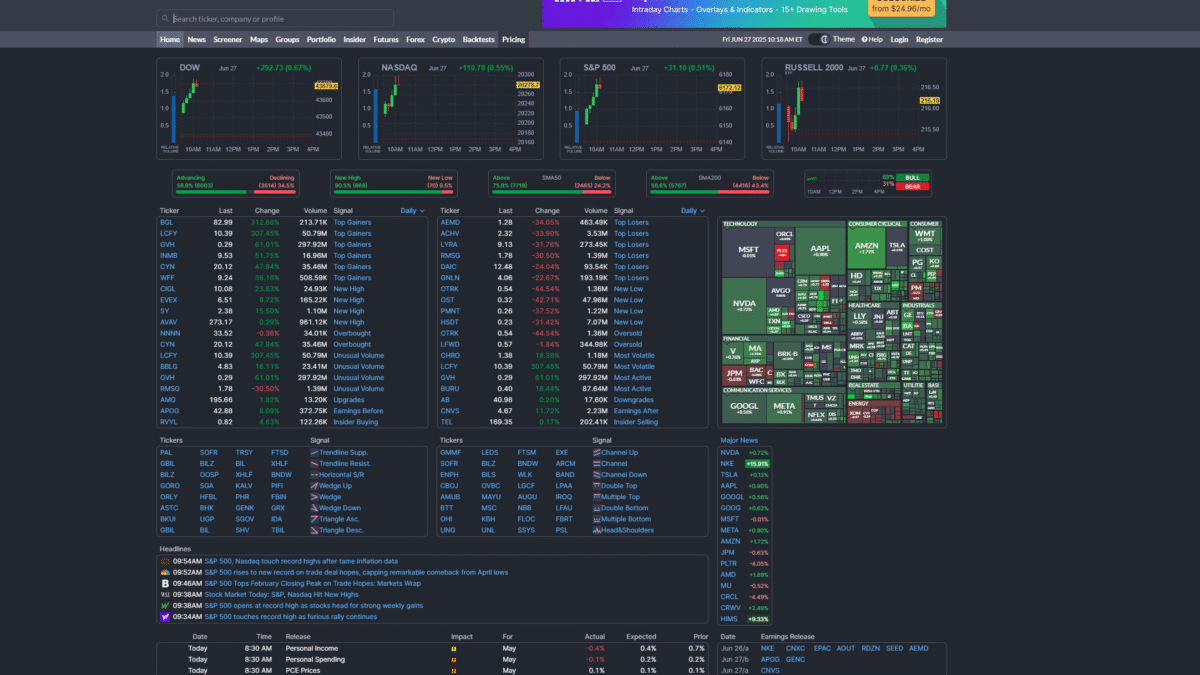
- Visual Heatmaps: Quickly see sectors and stocks that are hottest or coldest based on performance, volume, and relative change.
- Customizable Screener: Filter stocks by volatility metrics such as beta, ATR (Average True Range), and volume spikes to pinpoint the most active names.
- Real-Time Quotes: Monitor price action as it happens—including premarket and aftermarket sessions—so you never miss a sudden move.
- Instant Alerts: Set notifications for price thresholds, news releases, or new entries in your screener criteria to stay ahead when markets swing.
All these features work together to give you an edge when markets become erratic. Get Started with Finviz for Free Today
Essential Elite Features for Volatility Analysis
Real-Time and Extended Hours Data
Access stock quotes from market open through extended hours, starting at 4:00 AM. This continuous data feed ensures you catch overnight moves and react before the regular session begins.
Advanced Charts and Technical Studies
Conduct detailed technical analysis with interactive charting tools:
- Intraday charts with multiple timeframes
- Overlays like Bollinger Bands, VWAP, and moving averages
- Drawing tools to mark trendlines, support and resistance zones
- Fullscreen layouts and performance comparison charts
Backtests with 24 Years of Historical Data
Validate your volatility-based strategies before risking real capital. Backtest up to 100 indicators across decades of market data and compare results against benchmarks like SPY.
Correlation Tools
Discover stocks that move in tandem or inversely with each other using proprietary algorithms. Correlation analysis helps you diversify and balance your positions when volatility picks up.
Advanced Screener
Leverage a robust screener with:
- Data export capabilities for custom analysis
- Over 200 built-in presets and custom filters
- Statistics view highlighting key metrics like beta and ATR
Alerts & Notifications
Receive instant e-mail or push alerts for:
- Price crosses and new highs/lows
- News, ratings updates, and SEC filings
- Portfolio-specific events and screener matches
Pricing Plans to Suit Every Trader
Free Account
Ideal for beginners exploring volatility tools without commitment. Enjoy delayed quotes, basic maps, and a limited screener at no cost.
Elite Account
For active day traders, swing traders, and serious investors. At $39.50/month (or $24.96/month billed annually), you gain:
- Real-time data and extended hours quotes
- Advanced charts, overlays, and intraday timeframes
- Backtests, correlations, and full data export
- Ad-free interface and priority feature access
Maximizing Your Success During Volatile Periods
Combine Finviz’s screening filters with disciplined risk management. Focus on stocks with strong fundamentals and clear technical setups. Use alerts to stay nimble when sentiment shifts, and diversify with inversely correlated tickers to soften drawdowns.
Regularly review backtest results to refine your edge. Over time, these practices build confidence and help you embrace volatility as an opportunity rather than a threat.
Conclusion
Market swings are inevitable, but your approach to volatility determines your success. Finviz equips you with the insights and tools needed to identify breakout opportunities, manage risk, and optimize trading strategies. With a suite of features tailored for both novice and advanced traders, Finviz becomes your go-to partner in every market environment. Get Started with Finviz for Free Today