Unlock Liquidity Trading with Real-Time Order Book Heatmaps
In today’s fast-moving markets, mastering liquidity trading is your ticket to making smarter, data-driven decisions. Traditional charts show price and volume, but they leave you in the dark on where real orders sit before they execute. That’s where real-time order book heatmaps come in, illuminating every limit order on the exchange as it appears and disappears. With these insights, you spot support and resistance levels, gauge the strength of buyers versus sellers, and react faster than the crowd.
What Is Liquidity Trading?
Liquidity trading refers to strategies that exploit the ebb and flow of available orders in the market. Instead of guessing where price might go, you watch the order book—a live feed of every bid and ask at each price level. When liquidity clusters at a particular price, it creates a magnet or barrier. By understanding these pockets of supply and demand, you can time entries, exits, and stop placements with surgical precision.
Challenges of Traditional Order Book Tools
Most platforms offer only a snapshot of depth, refreshing once per second or slower. This latency hides high-frequency shifts in supply and demand. You might miss a fattening buy wall that’s absorbing sell orders, or fail to notice a big iceberg order slicing into the book. Without a clear view of order flow dynamics, you risk entering too late or getting caught on the wrong side of a breakout.
Why Real-Time Heatmaps Revolutionize Liquidity Trading
Heatmaps transform raw order data into a living, breathing landscape. Darker bands indicate high concentrations of resting orders, while brighter streaks show where orders were just consumed. By animating this data at up to 40 frames per second, you perceive microstructure shifts that static depth charts simply can’t reveal. This real-time clarity helps you:
- Identify true support and resistance zones before the crowd rallies.
- Detect hidden large orders splitting into smaller chunks.
- Observe the battle between aggressive buyers and sellers as it unfolds.
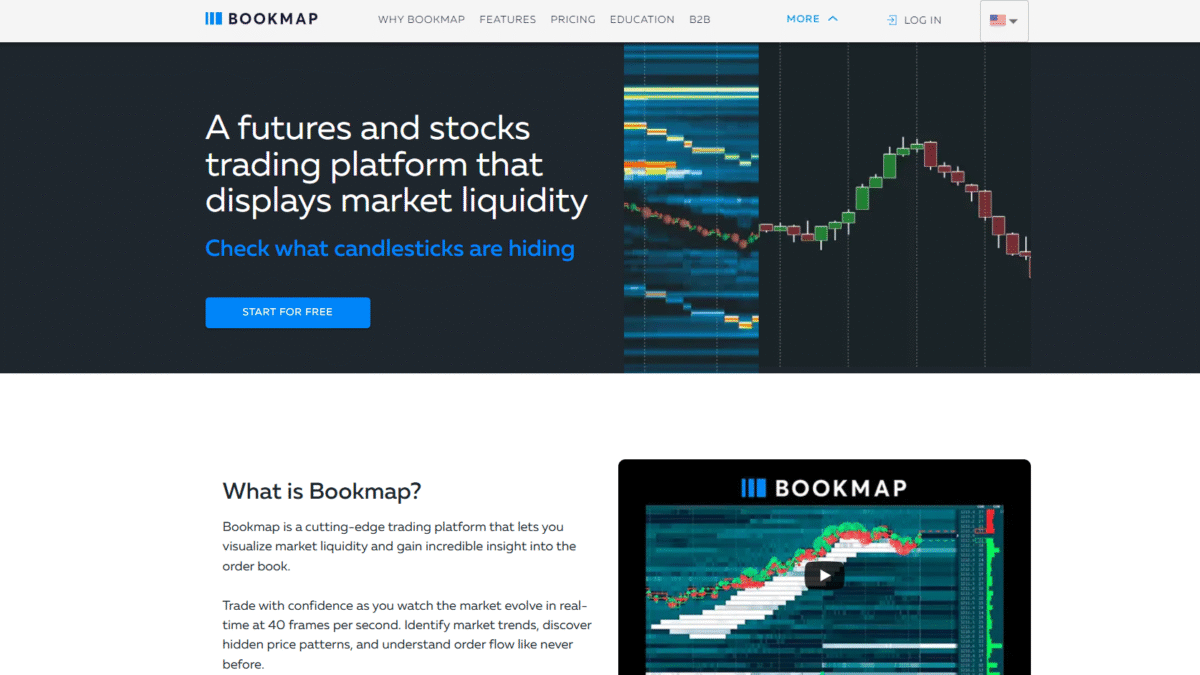
Introducing Bookmap: The Ultimate Heatmap Solution
Bookmap is a cutting-edge trading platform built for futures, stocks, and crypto. It visualizes market liquidity with unparalleled detail, giving you a live, high-fps view of order book dynamics. Whether you’re scalping micro-moves, day trading breakouts, or swing trading key levels, Bookmap’s real-time heatmap and volume analysis tools empower you to:
- See every limit order added, executed, or canceled across price levels.
- Spot iceberg trades and absorption patterns that signal reversals.
- Track how incoming market orders interact with resting liquidity.
Liquidity Heatmap
The core of Bookmap is its live heatmap, where color intensity reflects order size over time. This dynamic view reveals solid blocks of liquidity that create support or resistance, and it fades as orders get filled or pulled.
Volume Bubbles
Volume bubbles plot executed trades with size-weighted circles. Larger bubbles highlight major market orders that can tip the balance and reverse established trends in an instant.
Best Bid and Offer
Bookmap tracks the highest bid and lowest ask in real time, letting you see spread changes and capturing moments of exhaustion or aggressive absorption at the touchline.
Current Order Book
Customize your depth-of-market display to show multiple price levels, aggregated order sizes, or individual order footprints. This flexibility suits any trading style, from scalping to swing setups.
Nanosecond Zoom & Multi-Asset Coverage
Zoom down to micro-timeframes with video-game-style frame rates, then switch between futures, stocks, and crypto at the click of a tab. Multi-monitor traders can pop charts into separate windows for a full suite of instruments.
How to Get Started in 3 Easy Steps
- Install Bookmap and connect to your preferred market data provider or broker. For CME, CBOT, COMEX, and NYMEX data, subscribe to BookmapData.
- Join free live webinars—basic and advanced—to master order flow analysis.
- Begin trading with confidence by watching liquidity, volume bubbles, and heatmap patterns in real time.
Why Traders Love Bookmap
- Transparency: No more hidden orders—every bid and ask is visible.
- Speed: 40 fps updates capture microstructural shifts instantly.
- Versatility: Supports futures, equities, and cryptocurrencies.
- Backtesting & Replay: Record sessions for strategy refinement.
- Customization: Tailor charts, indicators, and heatmap colors to your workflow.
Start Unlocking Liquidity Trading Today
If you’re ready to elevate your trading by seeing the order book like never before, Get Started with Bookmap for Free Today. Discover how real-time heatmaps, volume bubbles, and deep order book insights can transform your strategies and boost consistency.